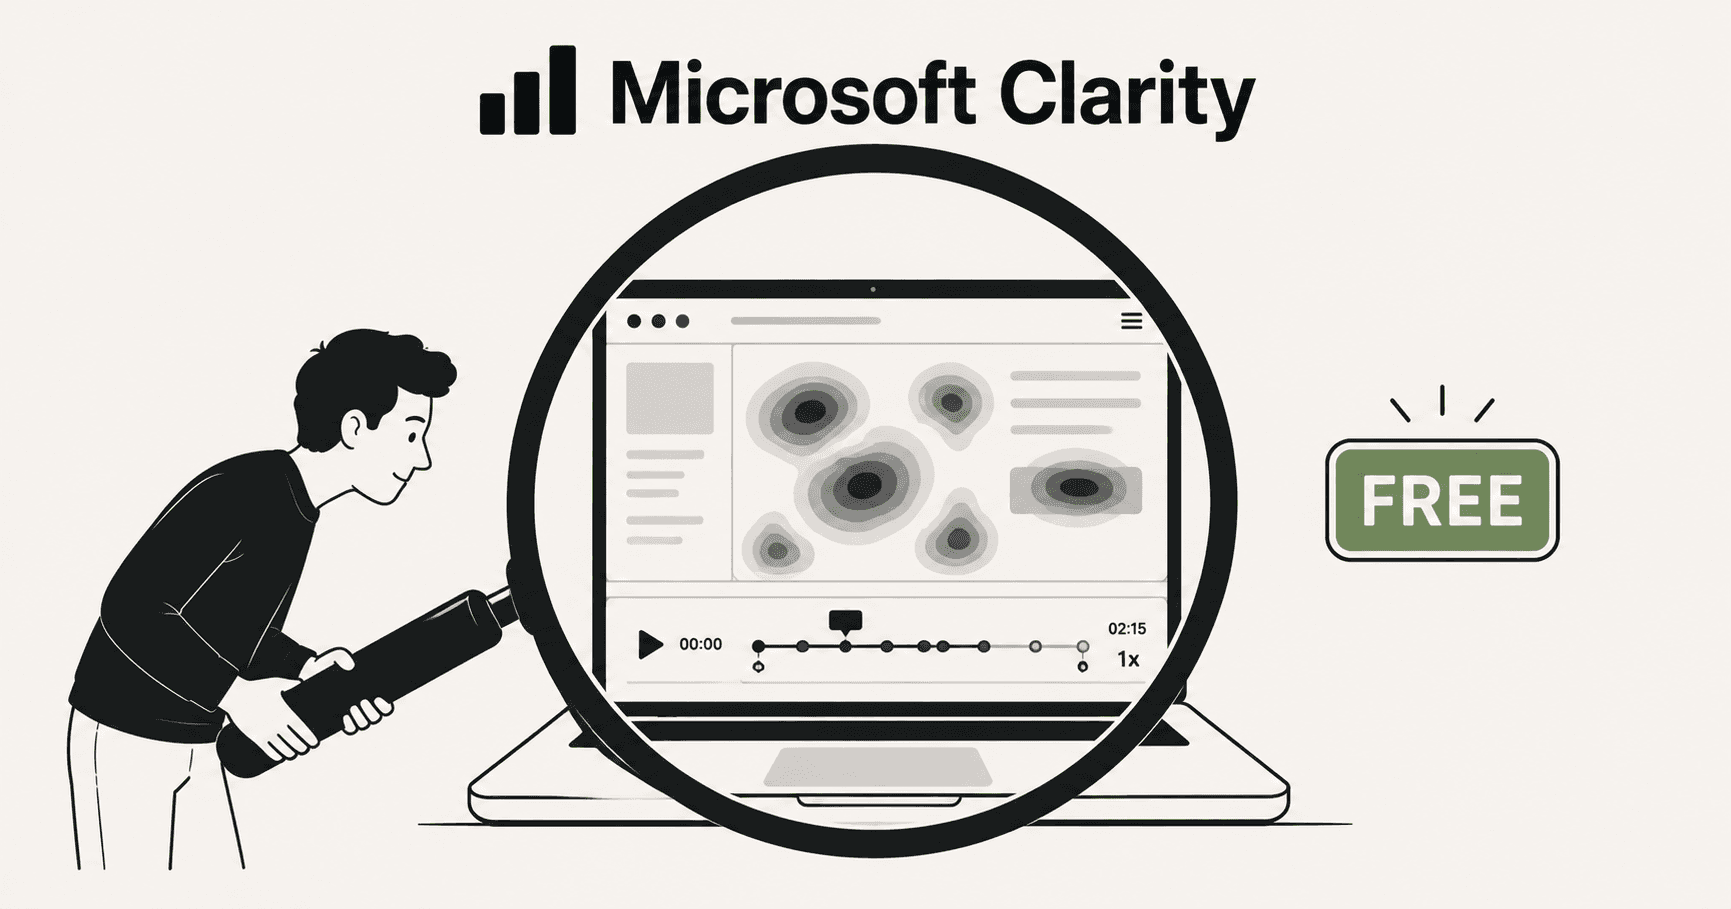
Microsoft Clarity is a free behavioural analytics tool that lets you see what visitors do on your website. It records sessions, generates heatmaps, and automatically flags problematic behaviour like rage clicks and dead clicks — all at no cost, with no session limits.
It launched in 2020 and has grown steadily since, largely because it does something no other serious analytics tool does: gives you meaningful behavioural data for absolutely nothing.
But free doesn't always mean the right tool for your situation. Here's exactly what Clarity does, what it doesn't do, and how to decide whether it's worth installing.
What Microsoft Clarity actually does
Session recordings
Clarity records every visitor session on your site — mouse movement, clicks, scrolls, and form interactions — with no daily cap and no session limit. Whether your site gets 100 visitors a day or 100,000, Clarity records them all.
Each recording is stored for 90 days and is filterable by a range of criteria: device type, browser, country, traffic source, pages visited, session duration, and behaviour type. You can watch recordings back at up to 10x speed, jump to specific interactions, and see exactly what a visitor did from the moment they arrived to the moment they left.
Heatmaps
Clarity generates three types of heatmaps automatically:
Click heatmaps — show where visitors click across your pages, aggregated across all sessions. You can see which elements attract the most clicks and which are ignored.
Scroll heatmaps — show how far down the page visitors scroll before leaving. Useful for understanding whether important content is being seen at all.
Area heatmaps — show which sections of a page attract the most attention, not just where clicks land.
Heatmaps in Clarity are built from your full traffic — not a sample — because there's no session cap limiting the underlying data.
Automatic frustration detection
This is Clarity's most distinctive feature and the one that sets it apart from basic recording tools.
Clarity automatically identifies and flags three types of problematic sessions:
Rage clicks — sessions where a visitor clicked the same element rapidly multiple times, usually in frustration because nothing was happening. Clarity flags these automatically and lets you filter directly to rage click sessions without manually watching recordings to find them.
Dead clicks — sessions where a visitor clicked on something that wasn't interactive. A non-linked image they expected to be clickable, text that looked like a button, an element that appeared interactive but wasn't. Dead clicks signal broken expectations and confused visitors.
Quick backs — sessions where a visitor arrived on a page and left almost immediately, then returned to where they came from. This is a strong signal that the page didn't match what the visitor expected — a message mismatch between the link they clicked and the page they landed on.
Being able to filter directly to these sessions — rather than watching random recordings hoping to find something interesting — is a genuine time saver and one of the most practically useful features in any behavioural analytics tool.
Google Analytics integration
Clarity integrates natively with GA4. Once connected, you can take any segment from Google Analytics — visitors from a specific traffic source, visitors who bounced, visitors who converted — and jump directly into the Clarity recordings for those specific visitors.
This is a powerful combination. GA tells you that visitors from paid social are converting at 0.4%. Clarity lets you watch what those specific visitors actually did on your site.
Copilot — AI-powered summaries
Clarity recently added a Copilot feature that uses AI to summarise what's happening in your recordings and heatmaps. Instead of watching recordings manually, you can ask Copilot questions like "why are visitors leaving my pricing page?" and get a summary based on the session data.
It's an interesting direction — moving from raw data toward plain-English answers — though the summaries are still fairly high-level and don't include the revenue impact estimation or specific fix suggestions you'd want to act on immediately.
What Microsoft Clarity doesn't do
No surveys or feedback widgets
Clarity is purely a behavioural analytics tool. It has no way to ask visitors direct questions — no on-page surveys, no feedback buttons, no NPS polls. If you want qualitative data alongside your behavioural data, you need a separate tool for that.
No form field analytics
Clarity shows you that visitors abandoned your form page. It doesn't show you which specific field caused the abandonment, how long visitors spent on each field, or which fields were corrected most. For that level of form analysis, Hotjar or Mouseflow are better options.
No funnel builder
Clarity doesn't let you define a multi-step conversion funnel and see where visitors drop off at each step. You can see session-level behaviour, but there's no aggregated funnel view showing step-by-step drop-off rates.
No revenue impact estimation
Clarity can tell you that 40% of visitors to your pricing page rage-clicked your CTA. It can't tell you what that's costing you in lost revenue. There's no mechanism for translating behavioural problems into business impact — you have to make that connection yourself.
No fix suggestions
Clarity identifies the problem. What to do about it is entirely up to you. The Copilot summaries gesture toward this, but there's no structured finding with a specific recommended fix and an estimated impact.
90-day data retention
Clarity only keeps recordings and heatmap data for 90 days. If you want to look back further than three months — to compare behaviour before and after a redesign, for example — the data won't be there.
Is Microsoft Clarity worth installing?
For most websites the answer is yes — and the reasoning is simple. It's free, it's unlimited, it takes about five minutes to install, and it gives you meaningful behavioural data you wouldn't otherwise have. The downside of installing it is essentially zero.
The more useful question is: what will you actually do with it once it's installed?
If you'll use it actively
Clarity is genuinely valuable if you have a specific question you're trying to answer about your site's behaviour — why is this page underperforming, what are visitors doing on this landing page, where are people dropping off in this form — and you have time to watch recordings and interpret heatmaps to find the answer.
The rage click and dead click filters make that investigation significantly faster than watching random recordings. The GA4 integration lets you focus on specific visitor segments. For a focused investigation with a specific goal, Clarity is an excellent free tool.
If you'll install it and rarely open it
This is the more common reality. Clarity gets installed alongside Google Analytics, sits there recording everything, and gets opened occasionally when something feels wrong — but not regularly enough to drive consistent improvement.
If that's how you'd use it, the question isn't whether Clarity is good. It's whether having more data you don't have time to analyse is actually solving your problem.
The underlying issue for most small businesses isn't access to behavioural data. It's having the time and expertise to turn that data into decisions. Clarity gives you the data. What to do with it is still entirely yours to figure out.
Clarity vs Hotjar — the quick version
If you're choosing between Clarity and Hotjar, here's the honest summary:
Choose Clarity if: you want heatmaps and session recordings for free with no session limits. Clarity does 80% of what Hotjar does at no cost. The automatic rage click and dead click detection is actually better than what Hotjar offers on its free plan.
Choose Hotjar if: you need surveys and feedback widgets, form field-level abandonment analytics, or longer than 90 days of data retention. These are the meaningful things Hotjar has that Clarity doesn't.
For most small businesses, Clarity is the right starting point. If you find yourself needing Hotjar's specific features — particularly the surveys — it's easy to add later.
What Clarity and Hotjar both can't do
Here's the thing worth understanding about Clarity — and about Hotjar — before you commit to either one.
Both tools give you data. Neither tool gives you answers.
Clarity can show you that 45% of mobile visitors rage-clicked your CTA button. It can't tell you that this is costing you approximately $1,400 a month in lost conversions. It can't tell you that the fix is a 200ms JavaScript delay on mobile that's making the button appear unresponsive. It can't suggest making the button stateless while the action processes. And it can't test whether that fix actually works.
That gap — between seeing the problem and knowing what to do about it — is where most small businesses and solo founders get stuck. They install Clarity. They can see that something is wrong. But converting that observation into a specific fix with a measurable outcome requires analysis time and expertise that most people don't have spare.
This is the gap Wahilens is built to close.
Wahilens watches every session automatically all week — tracking rage clicks, dead clicks, form drop-offs, scroll depth, and exit patterns — and then delivers a plain-English report to your inbox every Monday morning with every finding ranked by revenue impact.
Not "40% of visitors rage-clicked your CTA." Instead: "Your CTA button is unresponsive for 2–3 seconds on mobile after tap. 6 of 10 mobile visitors who reached this page left without converting. Estimated impact: ~$1,100/month. Suggested fix: add a loading state to the button so visitors know their tap registered."
That's a finding you can act on immediately. No recordings to watch. No heatmaps to interpret. No hypotheses to form. Just the problem, the cost, and the fix.
And if you want to prove the fix worked, Wahilens runs the A/B test automatically — old version against new version — and tells you which won and by how much.
Clarity is free and worth installing. Wahilens is $10/month and tells you what to do with what it finds. For most small businesses, the right answer is both — Clarity for raw behavioural visibility, Wahilens for the findings and fixes that turn that visibility into revenue.
The bottom line
What is Microsoft Clarity? A free, unlimited heatmap and session recording tool from Microsoft that automatically detects rage clicks, dead clicks, and quick backs.
Is it worth installing? Yes — it's free, unlimited, and takes five minutes to set up. There's no meaningful reason not to.
What does it not do? Tell you what to fix, estimate the revenue impact of problems, suggest specific fixes, or test whether those fixes work.
What should you use alongside it? Google Analytics for traffic data. Wahilens if you want plain-English findings ranked by revenue impact delivered to your inbox every week — without spending hours watching recordings yourself.
Install Clarity today. It costs nothing and you'll learn something. Just know what it can and can't tell you — so you know what to reach for next.
See it in action
Know exactly where your visitors drop off.
One script tag. No credit card. Your first report in under a week.
Start free trial