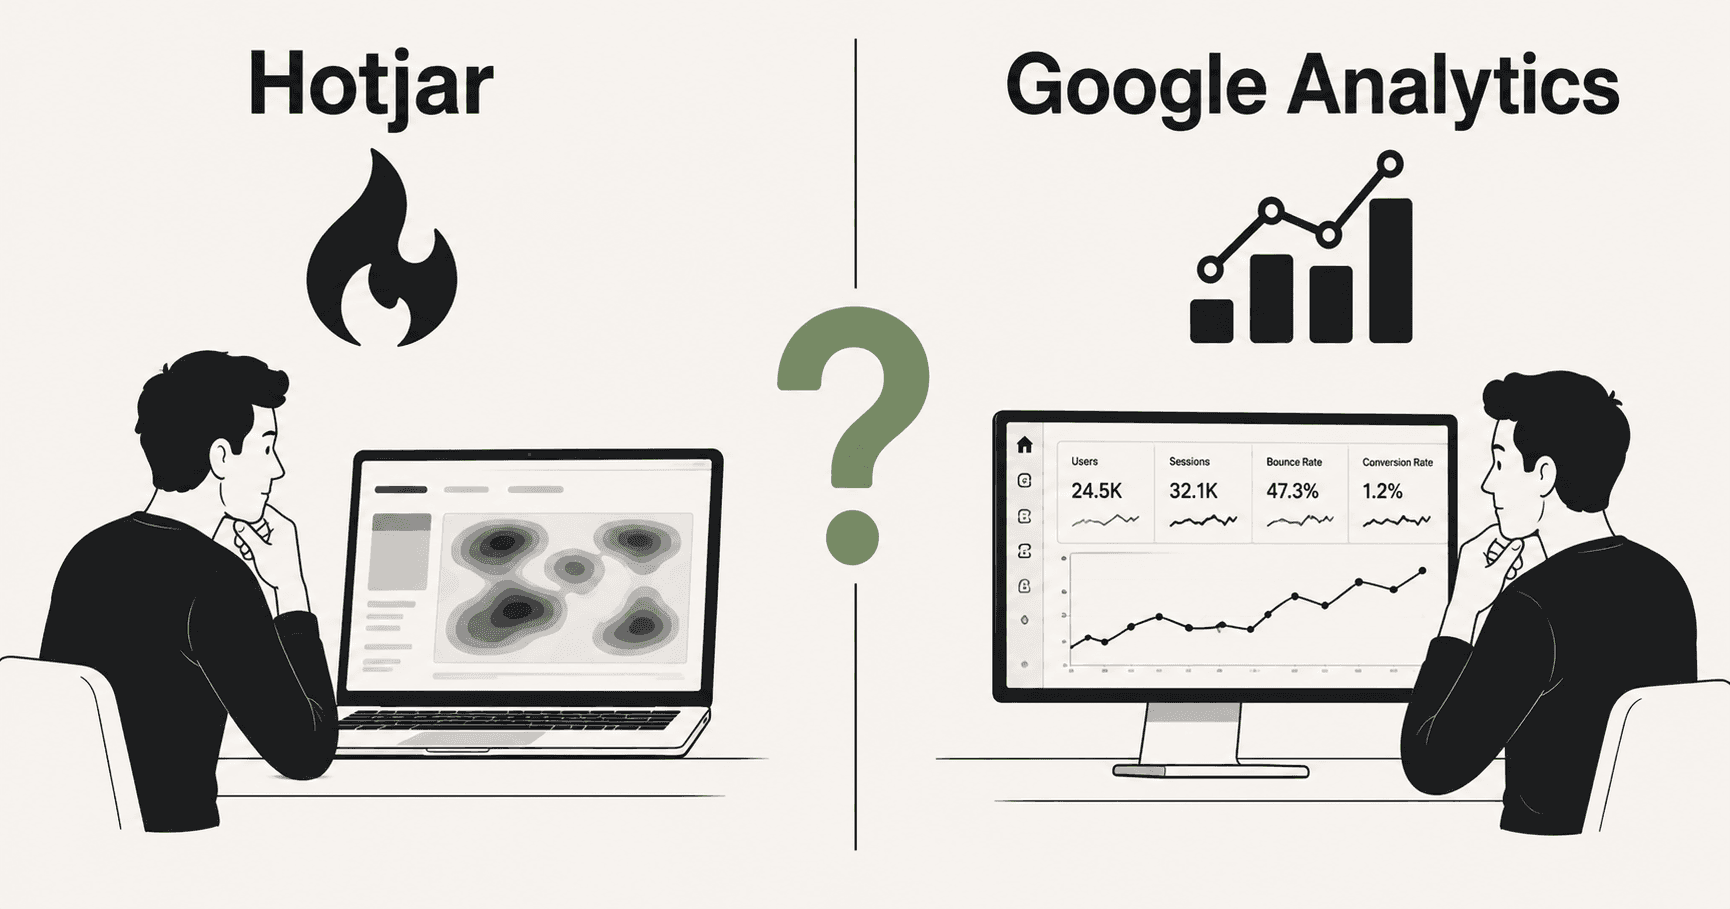
If you've been Googling "Hotjar vs Google Analytics", you've probably already noticed something strange: most comparison articles treat them like competing tools, as if you have to pick one or the other.
That framing is wrong. Hotjar and Google Analytics are not the same kind of tool. They answer completely different questions. Comparing them is a bit like comparing a speedometer to a dashcam — one tells you how fast you're going, the other shows you what happened on the road. You need both. They don't replace each other.
But that doesn't mean the comparison is useless. Understanding exactly what each tool does — and more importantly, what each one can't do — will tell you a lot about what's actually missing from your analytics stack.
So let's go through both properly.
What Google Analytics actually is
Google Analytics is a traffic and behaviour analytics platform. It answers the question: who is coming to my site, where are they coming from, and what are they doing at a high level?
It's the most widely used analytics tool in the world — and for good reason. The data it gives you is genuinely valuable. You can see exactly how many people visited your site, which pages they landed on, how long they stayed, which traffic sources sent them, what device they used, and where in the world they came from.
GA4, the current version, also tracks events — any specific action you define, like button clicks, form submissions, video plays, or scroll depth. If you set up your events properly, you can build a reasonably detailed picture of how visitors move through your site and where they drop off.
What Google Analytics does well:
Traffic analysis — how many visitors, from where, via which channel. Organic search, paid ads, social media, direct, referral — GA breaks it all down. If you're running multiple traffic sources, this is essential for knowing which ones are actually working.
Audience data — demographics, location, device, browser, new vs returning. If you want to know that 68% of your visitors are on mobile or that your best-converting traffic comes from the UK, GA tells you.
Conversion tracking — if you define goals or conversion events, GA tracks them. You can see your overall conversion rate, which pages convert best, and which traffic sources produce the most conversions.
Funnel analysis — GA4 lets you build exploration funnels that show where visitors drop off in a multi-step process. If you have a signup flow with four steps, you can see exactly which step loses the most people.
Long-term trends — GA keeps data indefinitely (in most configurations) and lets you compare periods. Year-over-year traffic, month-over-month conversion rate, the impact of a campaign — all visible over time.
Google Analytics is free. It's deeply integrated with Google Ads, Google Search Console, and the rest of the Google ecosystem. For any website with traffic, it's essentially non-negotiable — you should have it installed regardless of what else you use.
What Hotjar actually is
Hotjar is a behavioural analytics platform. It answers a completely different question: what are individual visitors actually doing on my pages?
Where Google Analytics shows you aggregated numbers — 5,000 visitors, 47% bounce rate, 1.2% conversion rate — Hotjar shows you behaviour. You can watch a recording of a real visitor moving around your site. You can see a heatmap showing where hundreds of visitors clicked. You can see how far down a page most people scroll before leaving.
What Hotjar does well:
Session recordings — individual recordings of real visitor sessions, with mouse movement, clicks, scrolls, and form interactions captured. You can filter recordings by traffic source, device, behaviour, or conversion outcome.
Heatmaps — aggregated click, scroll, and move maps that show where attention concentrates across many sessions. Useful for understanding which page elements attract attention and which are ignored.
Form analytics — field-by-field analysis of form abandonment. You can see which specific field causes the most drop-offs, how long people spend on each field, and which fields get corrected most.
Surveys and feedback — on-page surveys, NPS polls, and feedback widgets that let you ask visitors direct questions. This qualitative layer is something Google Analytics can't provide at all.
Hotjar has a free plan with significant limitations — 35 daily sessions and basic features. Paid plans start around $39/month and scale by session volume.
Why people compare them when they shouldn't
The reason Hotjar and Google Analytics get compared is that both are described as "analytics tools" — and when you're trying to understand why your site isn't converting, both feel like potential answers.
But they operate at completely different levels.
Google Analytics tells you that 1,000 people visited your pricing page last month and 47 of them converted. Hotjar shows you what those 1,000 people actually did on the pricing page — where they clicked, how far they scrolled, which ones rage-clicked your CTA button.
One gives you the what. The other gives you the how. Neither gives you the why. And the why is what you actually need to fix things.
This is why the most common advice is to use both together — GA for traffic and conversion data, Hotjar for behavioural investigation. If GA shows you that your pricing page has a high exit rate, you go to Hotjar to watch recordings and understand what's happening there.
That's a reasonable workflow. But it has a significant cost: time.
Side by side
| Hotjar | Google Analytics | |
|---|---|---|
| Price | Free (limited) / from $39/month | Free |
| Primary question | What are visitors doing on my pages? | Who is visiting and where from? |
| Session recordings | Yes | No |
| Heatmaps | Yes | No |
| Traffic source data | No | Yes |
| Audience demographics | Basic | Detailed |
| Conversion tracking | Limited | Yes |
| Funnel analysis | Basic | Yes (GA4) |
| Form analytics | Yes | No |
| Surveys and feedback | Yes | No |
| Long-term trend data | Limited | Yes |
| Real-time data | No | Yes |
| Google Ads integration | No | Native |
Where Google Analytics wins
Traffic intelligence. If you want to know where your visitors are coming from and which sources are actually driving conversions, GA is unmatched. Hotjar has no meaningful traffic source data — you can filter recordings by source, but there's no aggregated channel-level analysis.
Long-term data. GA keeps data for as long as you need it (within retention settings). If you want to compare this August to last August, or track how your conversion rate has changed over two years, GA is the only tool of the two that can do it.
Real-time reporting. GA shows you live visitor data — who's on your site right now, which pages they're on, where they came from. Hotjar has no real-time capability.
Ad integration. If you're running Google Ads, GA's native integration lets you see exactly which campaigns, ad groups, and keywords are driving conversions. This is essential for any paid traffic strategy and completely absent from Hotjar.
It's completely free. GA4 has no meaningful limitations for most businesses. You get the full feature set for nothing.
Where Hotjar wins
Behavioural visibility. No amount of GA data tells you what a visitor actually did on a page. Session recordings fill that gap entirely. When you can watch a visitor struggle with your checkout form, or see them click your CTA three times in frustration before leaving, you understand something no spreadsheet can show you.
Heatmaps. Aggregated click and scroll maps give you a fast visual read on how a page is performing across many sessions. GA has no equivalent.
Form analytics. If you have a lead form, a signup flow, or a checkout, knowing which specific field causes abandonment is enormously valuable. GA can tell you that people left your form page. Hotjar can tell you they left at the phone number field.
Qualitative research. Hotjar's surveys and feedback widgets let you ask visitors direct questions — why are you leaving? What stopped you from signing up? This kind of direct feedback is something no quantitative tool can replicate.
Where both fall short
Here's what neither tool tells you — and it's the thing you actually need most.
Google Analytics shows you numbers. A 47% bounce rate. A 1.2% conversion rate. A high exit rate on the pricing page. These numbers tell you something is wrong. They don't tell you what, or why, or what to do about it.
Hotjar shows you footage. A recording of someone who bounced. A heatmap with a hotspot on a button that isn't converting. You can see what happened. You still have to figure out why — and what it's costing you — yourself.
Put them together and you get a more complete picture. But you still have to do the hardest part: watch the recordings, spot the patterns, form the hypotheses, prioritise the fixes, and decide what to test. For a solo founder or a small team, that's often several hours a week of work that produces uncertain conclusions.
What's missing from both is the answer in plain English.
Not more data. The answer. "This specific thing is broken on this specific page, it's costing you approximately this much per month, and here's what to fix."
That's what Wahilens does. It watches every session automatically all week — tracking rage clicks, dead clicks, form drop-offs, scroll depth, and exit patterns — and then delivers a plain-English report to your inbox every Monday morning with every finding ranked by revenue impact.
You don't watch recordings. You don't interpret heatmaps. You don't build hypotheses. You get: "8 of 10 visitors who reached your pricing page left within 12 seconds. Your CTA is receiving dead clicks on mobile — it appears unresponsive for 2–3 seconds after tap. Estimated impact: ~$1,600/month."
Then Wahilens suggests the fix, and if you want to prove it worked, runs an A/B test automatically. The whole loop — find, fix, prove — without a dashboard, without recordings, without any of the interpretive work that makes tools like Hotjar and Google Analytics so time-consuming to act on.
Which one should you use?
The honest answer is: both, and they serve different purposes.
Use Google Analytics if you want to understand your traffic — where visitors come from, which channels convert, how your overall numbers trend over time. This is table stakes. Every website should have GA4 installed.
Add Hotjar if you have the time to watch session recordings regularly and you want to investigate specific behavioural questions — why is this page underperforming, what is happening on this form, where are people clicking. The free plan is limited but enough to get started.
Use Wahilens if you want the answer instead of the data. If you don't have hours to spend watching recordings and interpreting heatmaps. If you want to know what's costing you money, ranked by impact, delivered to your inbox every week — with the fix suggested and the test run automatically.
Most small businesses and founders end up with GA installed, Hotjar opened occasionally, and a vague sense that they should be doing more with the data but not enough time to do it.
That gap — between having the data and knowing what to do with it — is exactly what Wahilens is built to close.
See it in action
Know exactly where your visitors drop off.
One script tag. No credit card. Your first report in under a week.
Start free trial